
NarraGraph – Visualizing Stories
After a year of working on it as a hobby project, Narragraph is finally live!
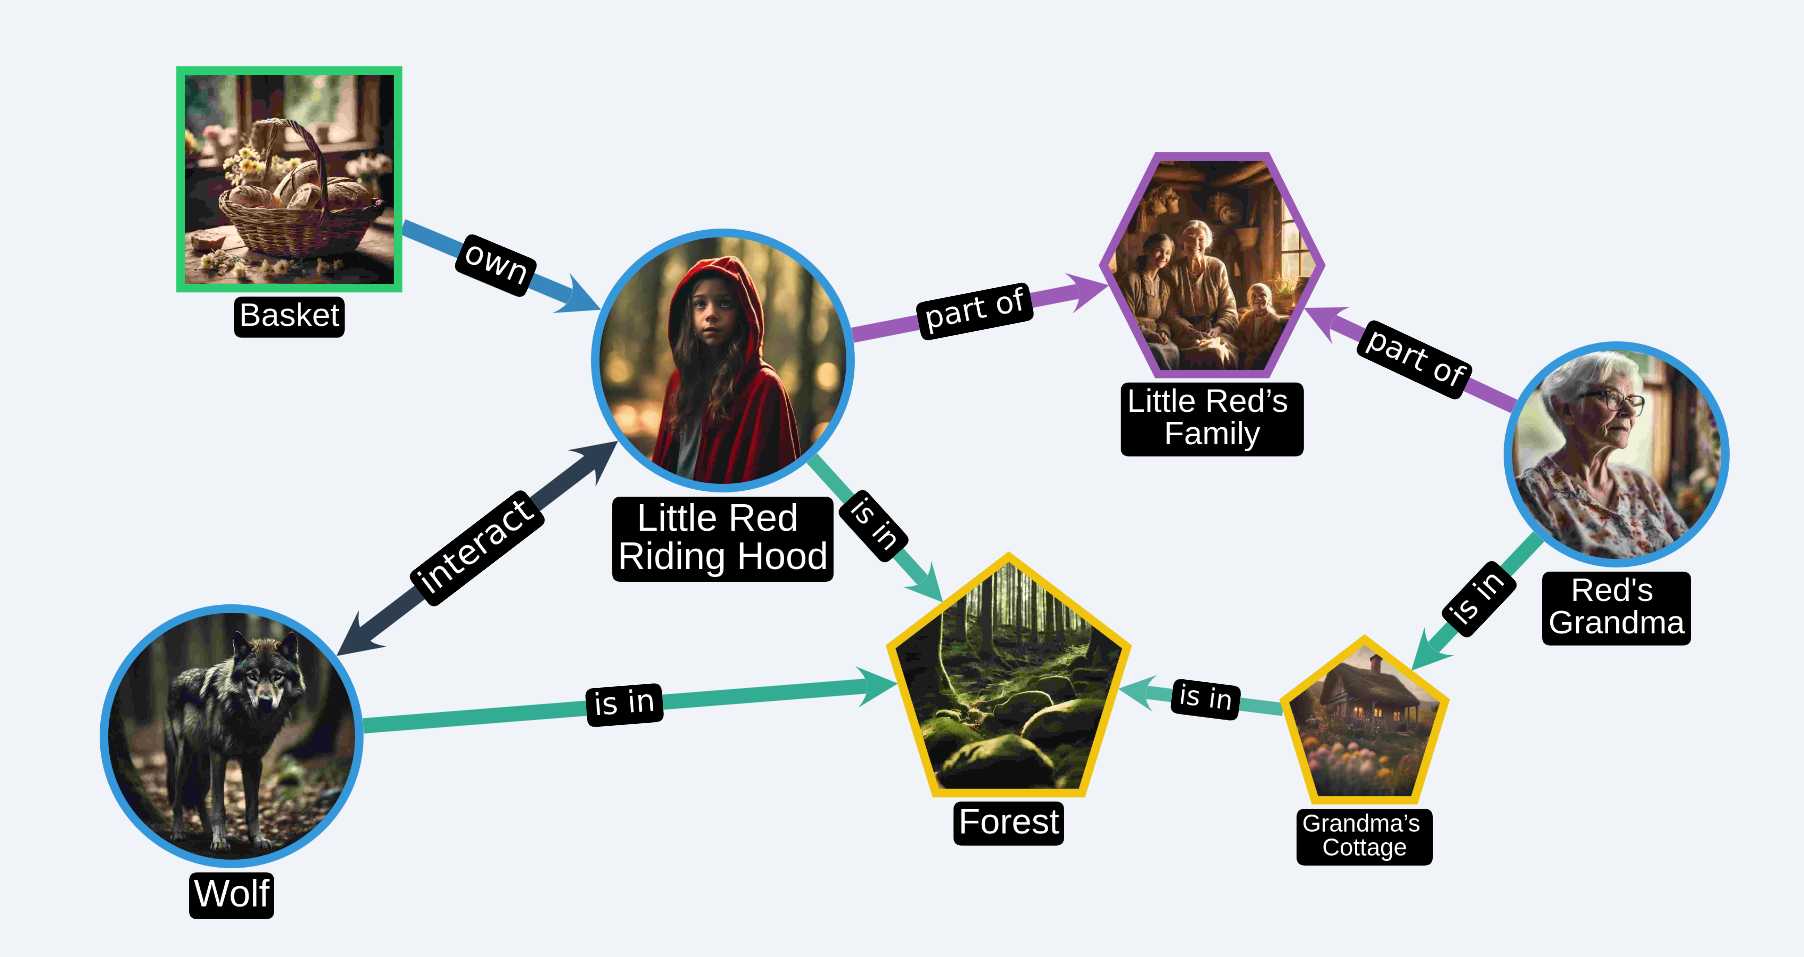
NarraGraph is a tool for writers, worldbuilders, and TTRPG DMs to visualize how characters, places, and events connect and evolve over time. Think of it as a “Google Maps” for story graphs: interactive, clear, and designed to make complex narratives easier to explore.
Working on NarraGraph was a full-stack learning experience, from picking the right technologies to integrating them smoothly:
- Frontend: React, Next.js, Material-UI
- Graph visualization: Cytoscape.js
- Backend: FastAPI, Kùzu, SQLite
- Cloud infrastructure: Google Cloud Storage, Firebase, Google Compute Engine
- UI/UX design: observing user behavior to improve interface and interactions
- Software architecture: data schemas and specifications
- Testing: pytest for unit tests
- Version control: structured Git workflow on GitHub
It’s been really rewarding to turn a simple idea into a fully functional tool outside of my day-to-day work.
Story Progression in Action
Here’s a short video showing how a story unfolds in NarraGraph:
Check it out: https://narragraph.com
Written on September 15, 2025