
How to Paint a Periodic Zebra? (in Python)
Periodic patterns are everywhere—from zebra stripes to the molecular world. These patterns often hold hidden structures that demand innovative approaches to understand. In this post, we’ll explore an elegant and unconventional solution to a relatively common challenge in periodic simulations: painting a “periodic zebra.”

We’ll use the concept of permutation parity to separate striped domains under periodic boundary conditions (PBC). Along the way, you’ll see how abstract mathematical ideas can inspire elegant solutions to practical problems.
Why You Should Care About Periodic Zebras
Understanding periodic patterns is critical for scientists and engineers. In molecular simulations, for instance, systems often behave as if they “wrap around,” creating periodic boundaries. While this simplifies computations, it complicates analysis because particles can “teleport” between edges of the simulation box.
One practical problem in such simulations is phase separation: distinguishing between coexisting regions, often organized as stripes. This is where periodic zebras come into play. By “painting” points into distinct regions, we can analyze their properties more effectively.
What is a Periodic Zebra?
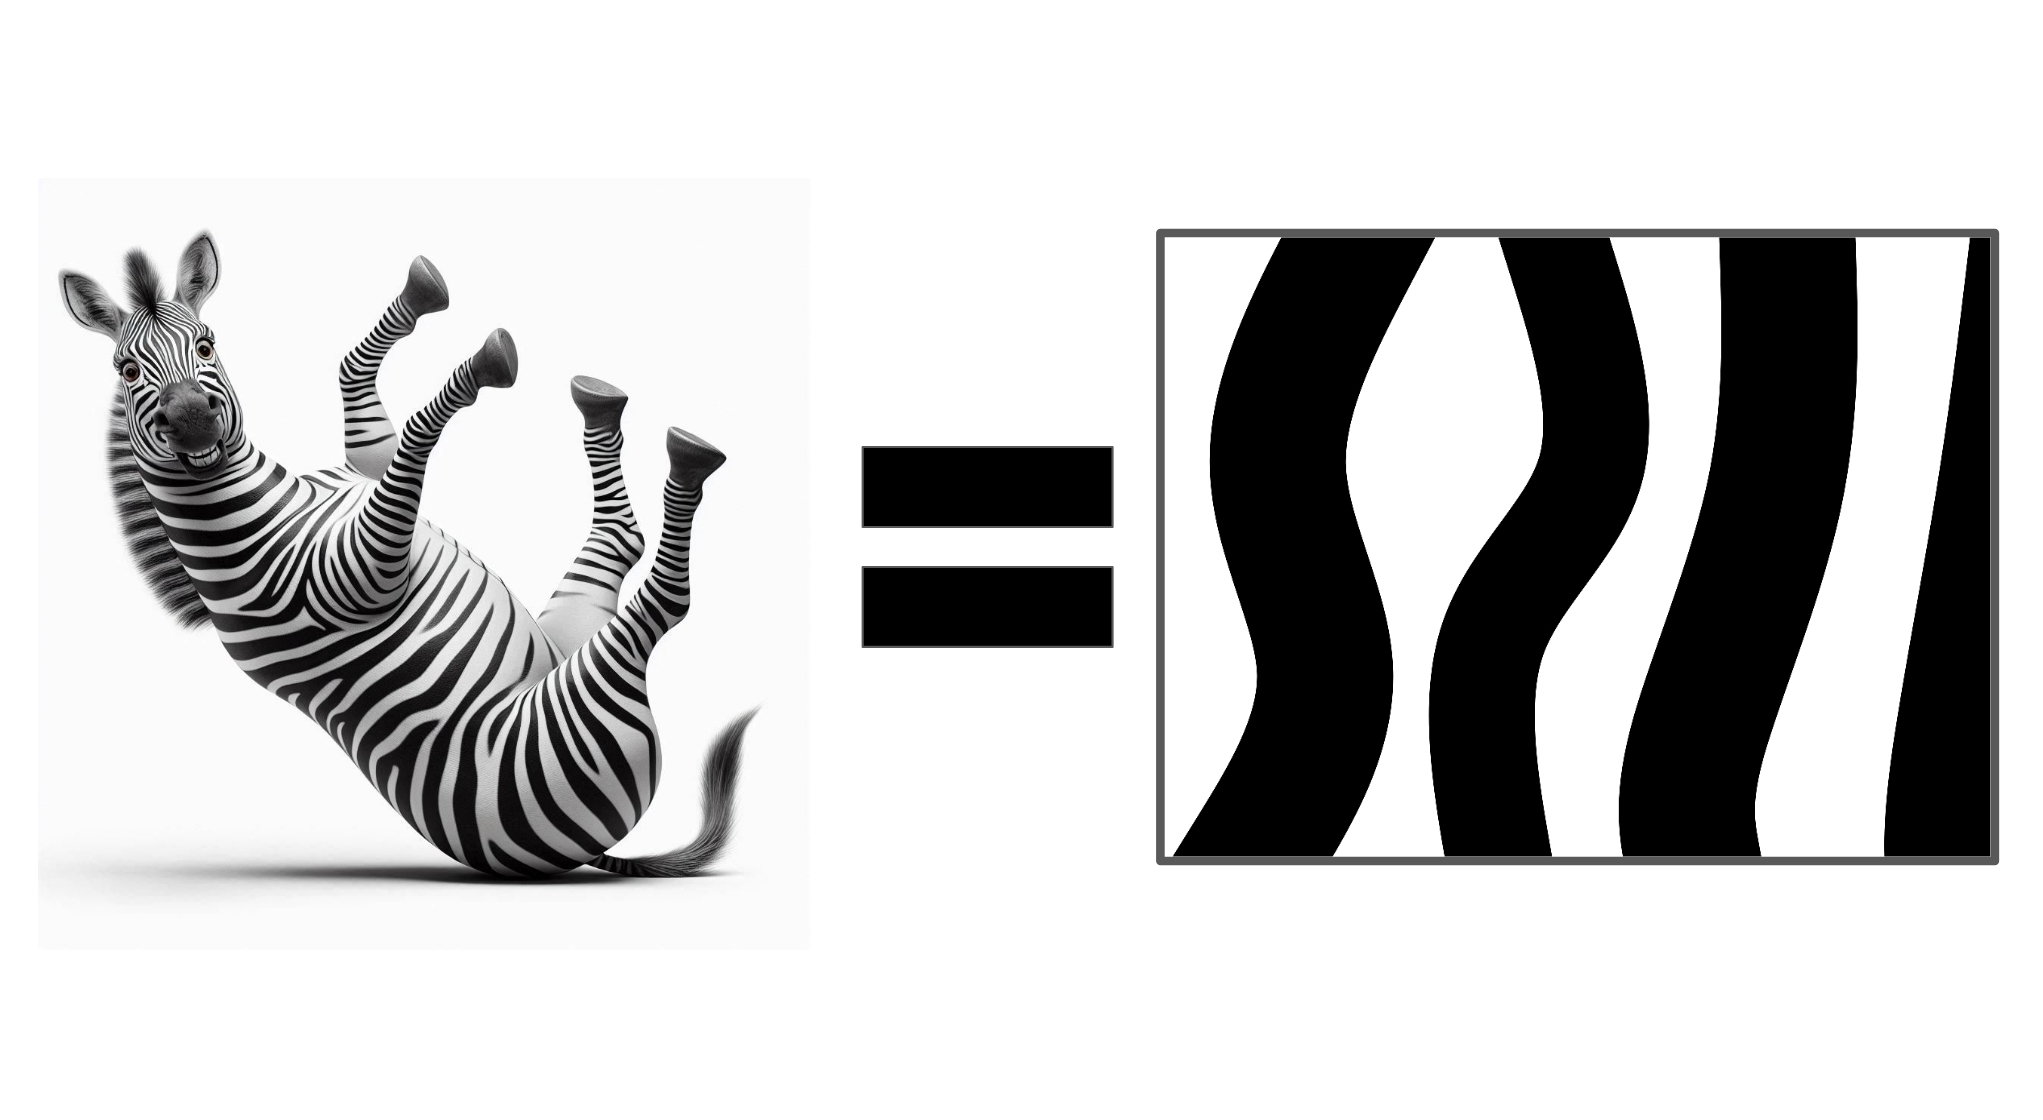
As a physicist, I naturally begin by approximating my zebra as a rectangle with wiggly black-and-white stripes:
This is still just a standard zebra. What makes it periodic? To introduce periodicity, we require that the stripes follow a repeating pattern in both the $x$ and $y$ directions.
In mathematical terms, this means the rectangle becomes a unit cell that tiles the space seamlessly when translated horizontally and vertically. Below, the middle box represents the unit cell, while the surrounding boxes are its periodic translations:
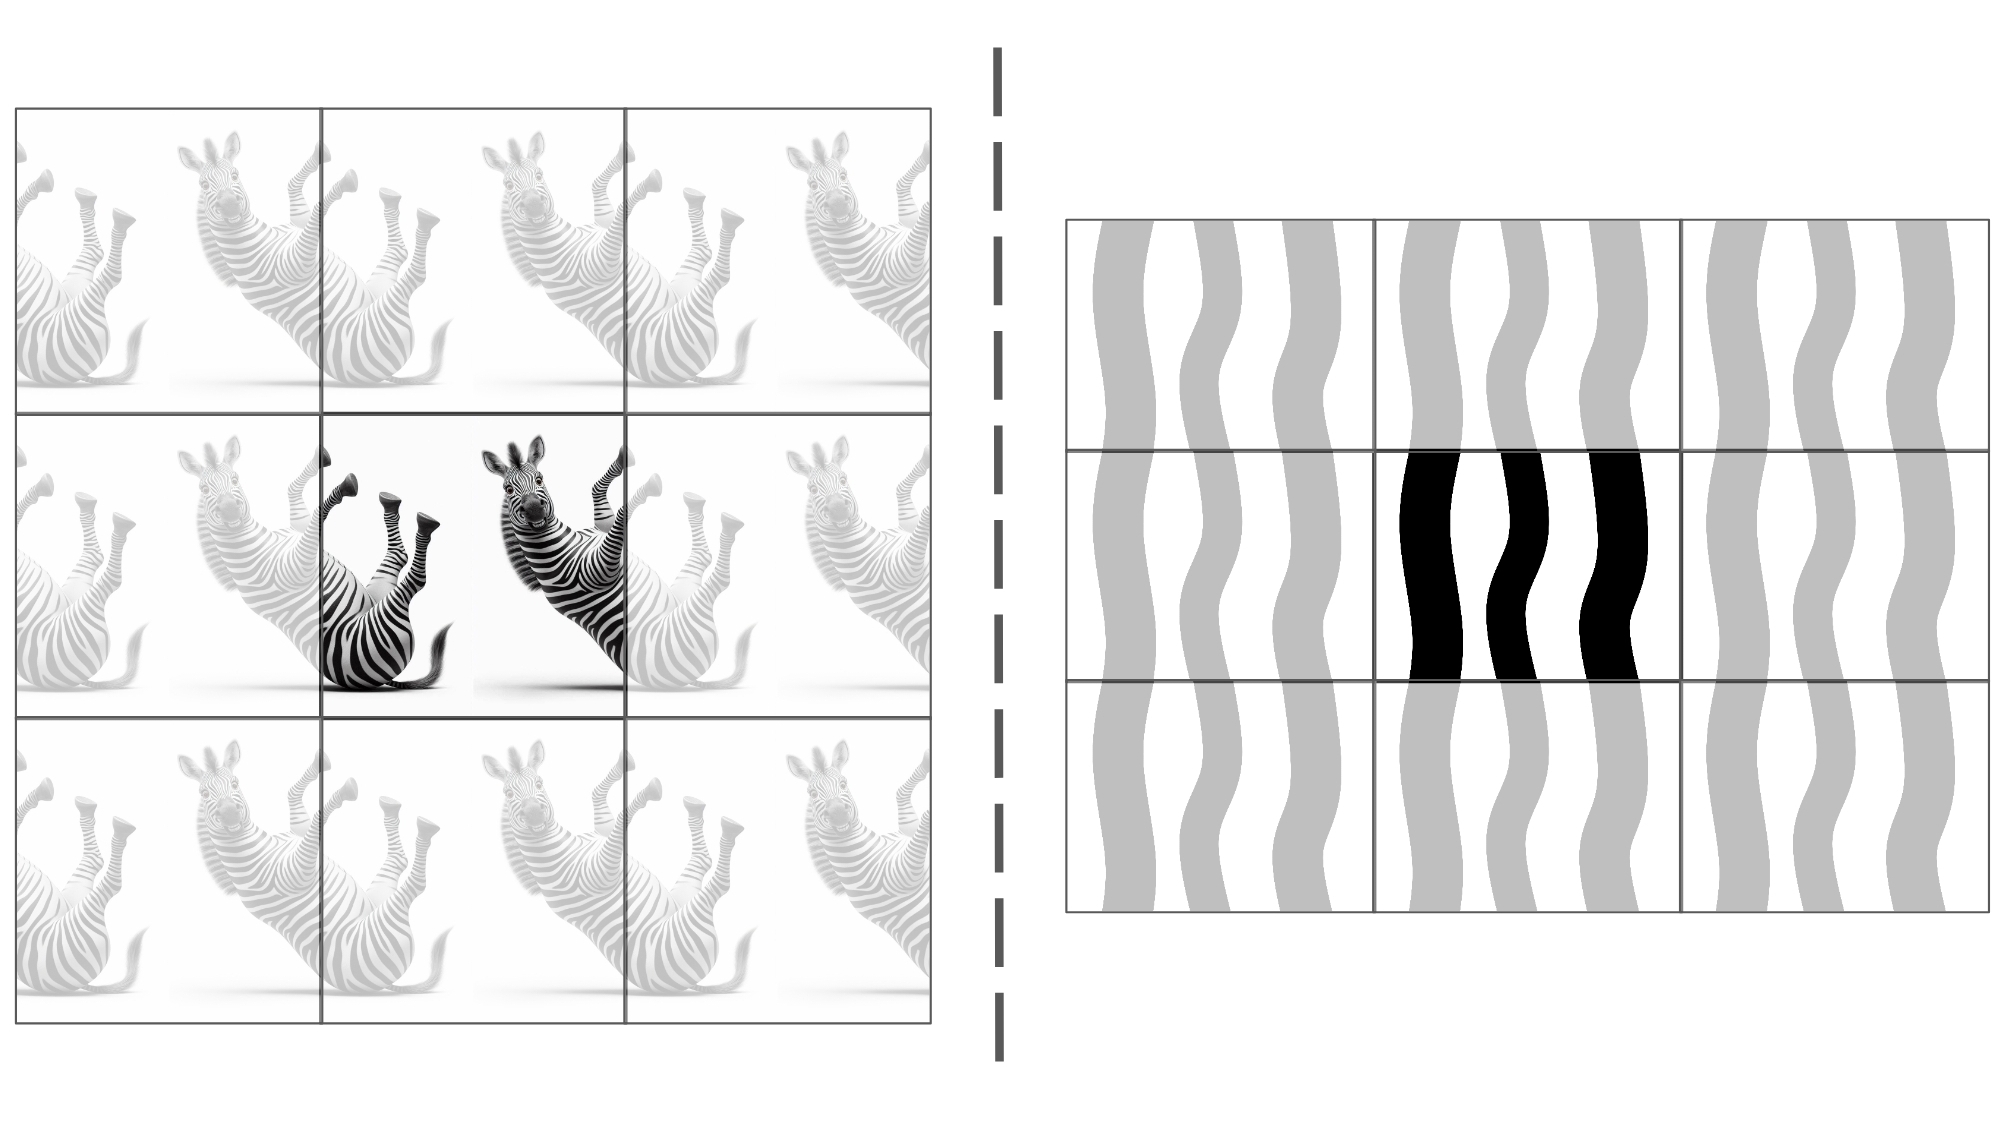
By this definition, we now have a periodic zebra! By requiring the stripes to connect seamlessly across boundaries, we’ve transformed a simple zebra into a mathematical system.
The Problem: Painting Points Under PBC
Imagine we’re given:
- A set of points scattered across a periodic rectangle.
- An even number ($2k$) of interfaces (lines) that separate the stripes.
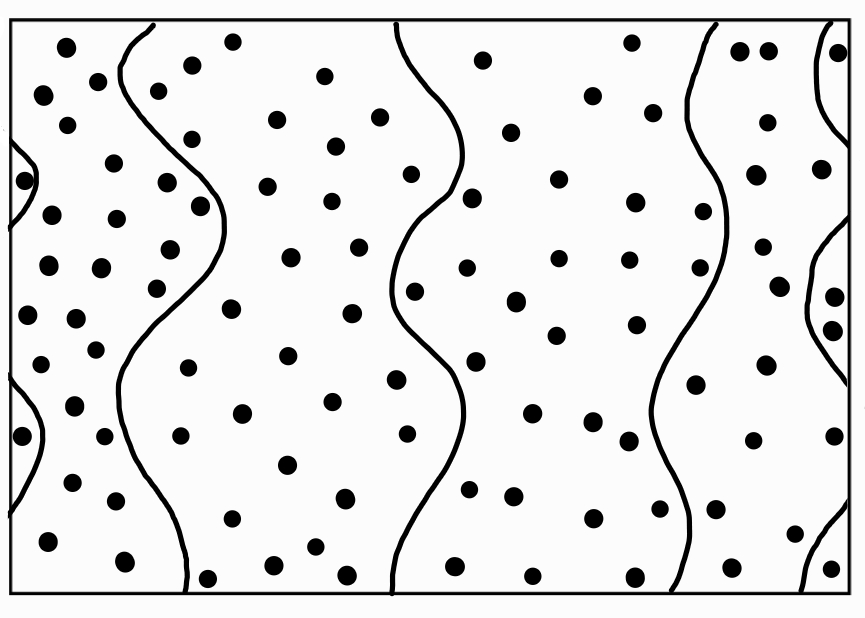
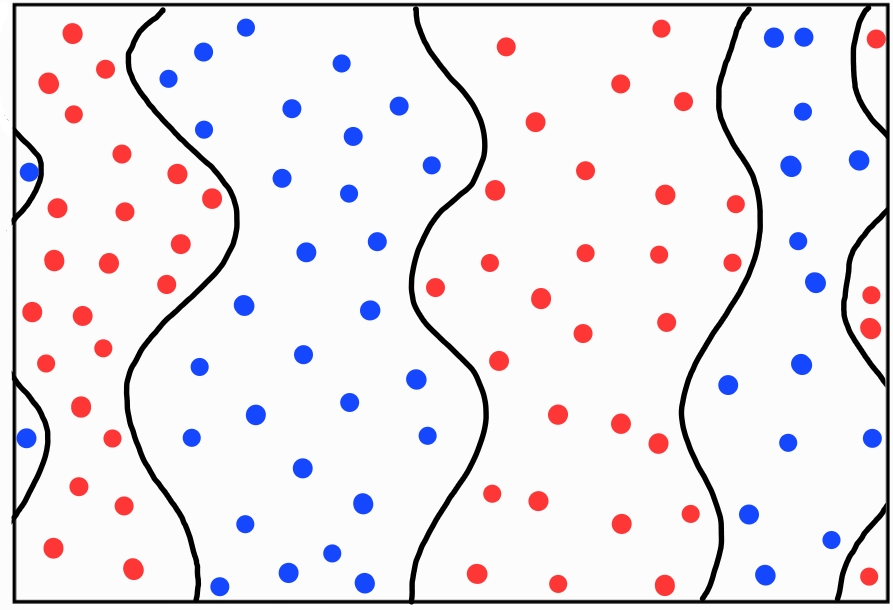
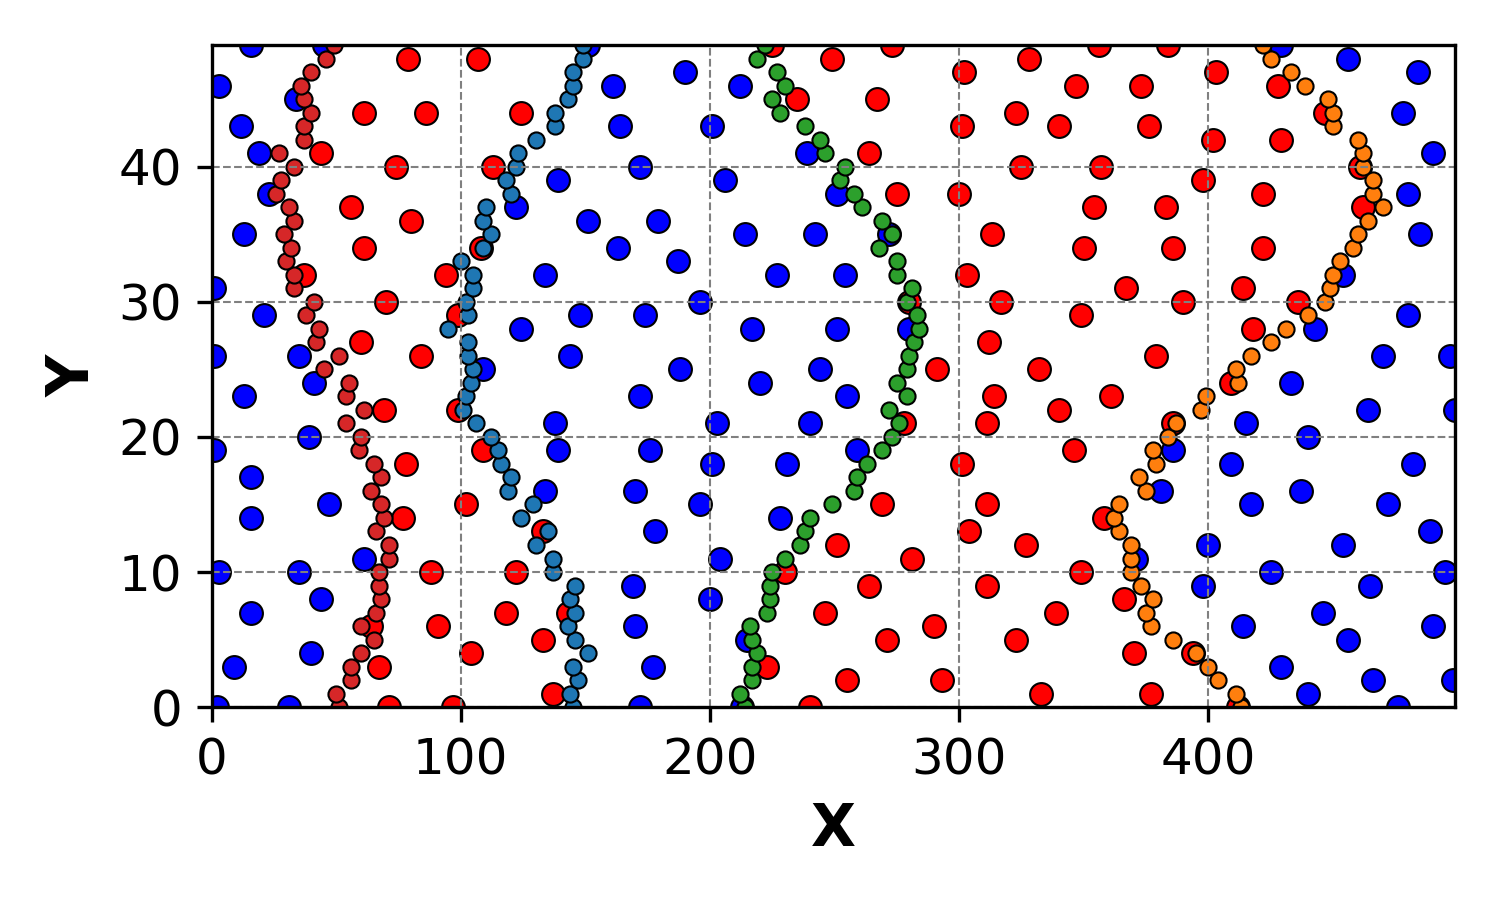
Our task: assign each point to a stripe (black or white – or blue or red as done below) based on its position relative to the lines, while respecting periodic boundaries.
Key Constraints:
Line Behavior:
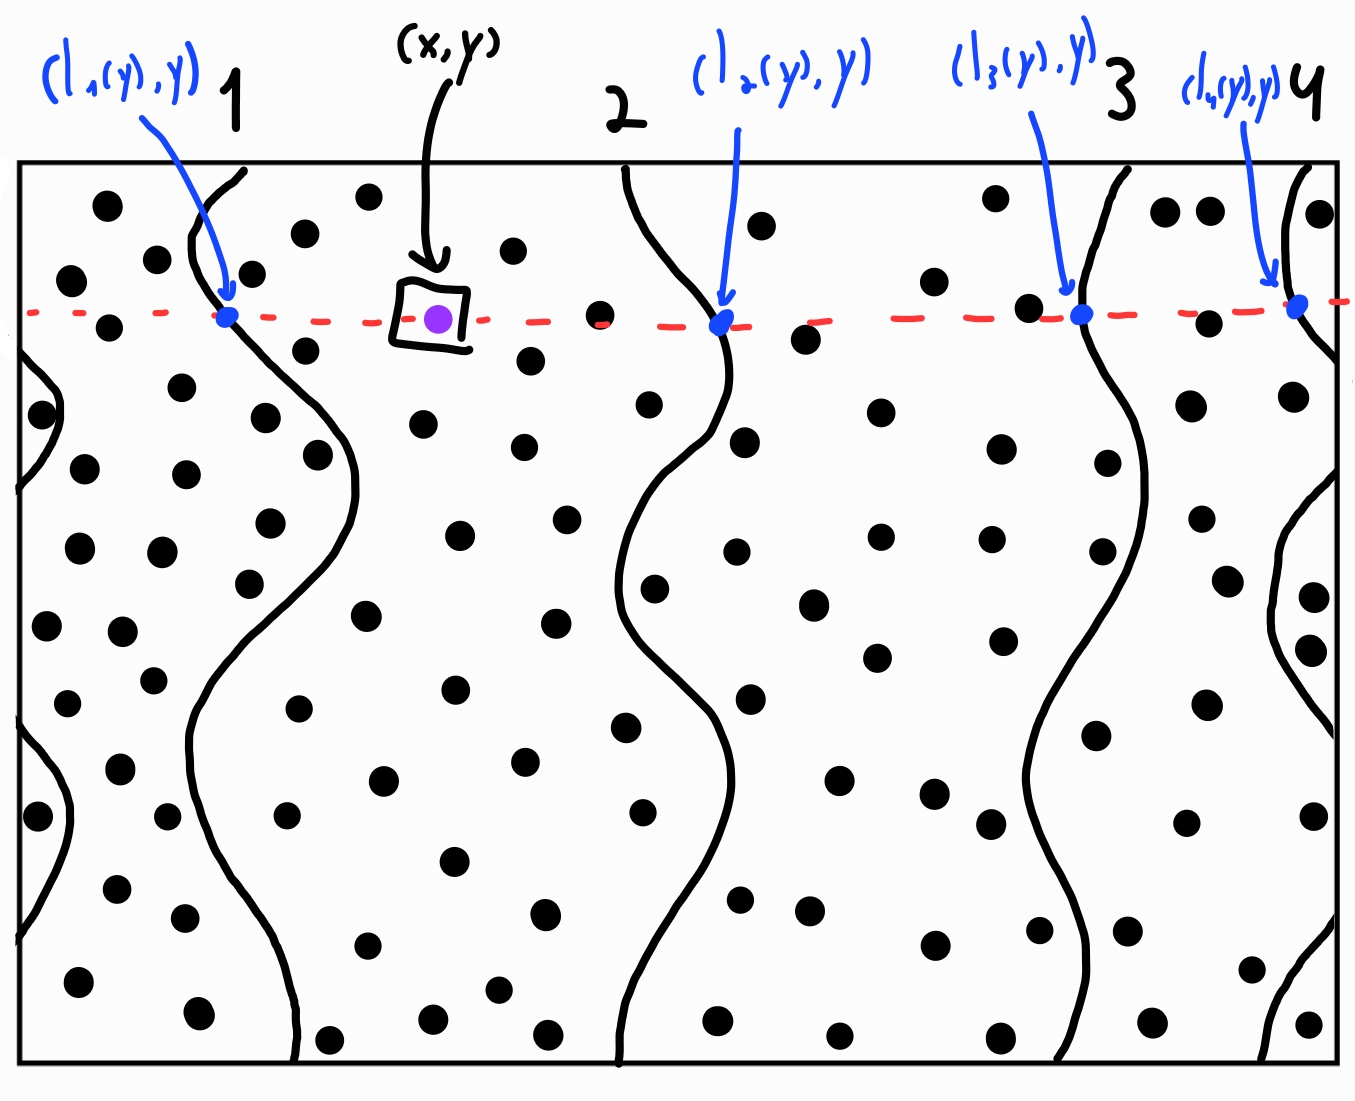
Each interface line, $l_i(y)$, represents the $x$-coordinate of the $i$th line at a given height $y$. To ensure proper behavior:
- The lines must be uniquely defined as functions of $y$:
- No line can cross any horizontal line $y=c$ more than once.
- The lines cannot cross or overlap one another.
- Points cannot lie exactly on any line, as such points are considered interfacial and cannot belong to either stripe.
These constraints guarantee that the stripes are well-defined, and every point can be unambiguously assigned to a region.
Periodicity:
The pattern repeats seamlessly across boundaries.
Stripe Assignment:
Each point must belong to exactly one stripe (blue or red).
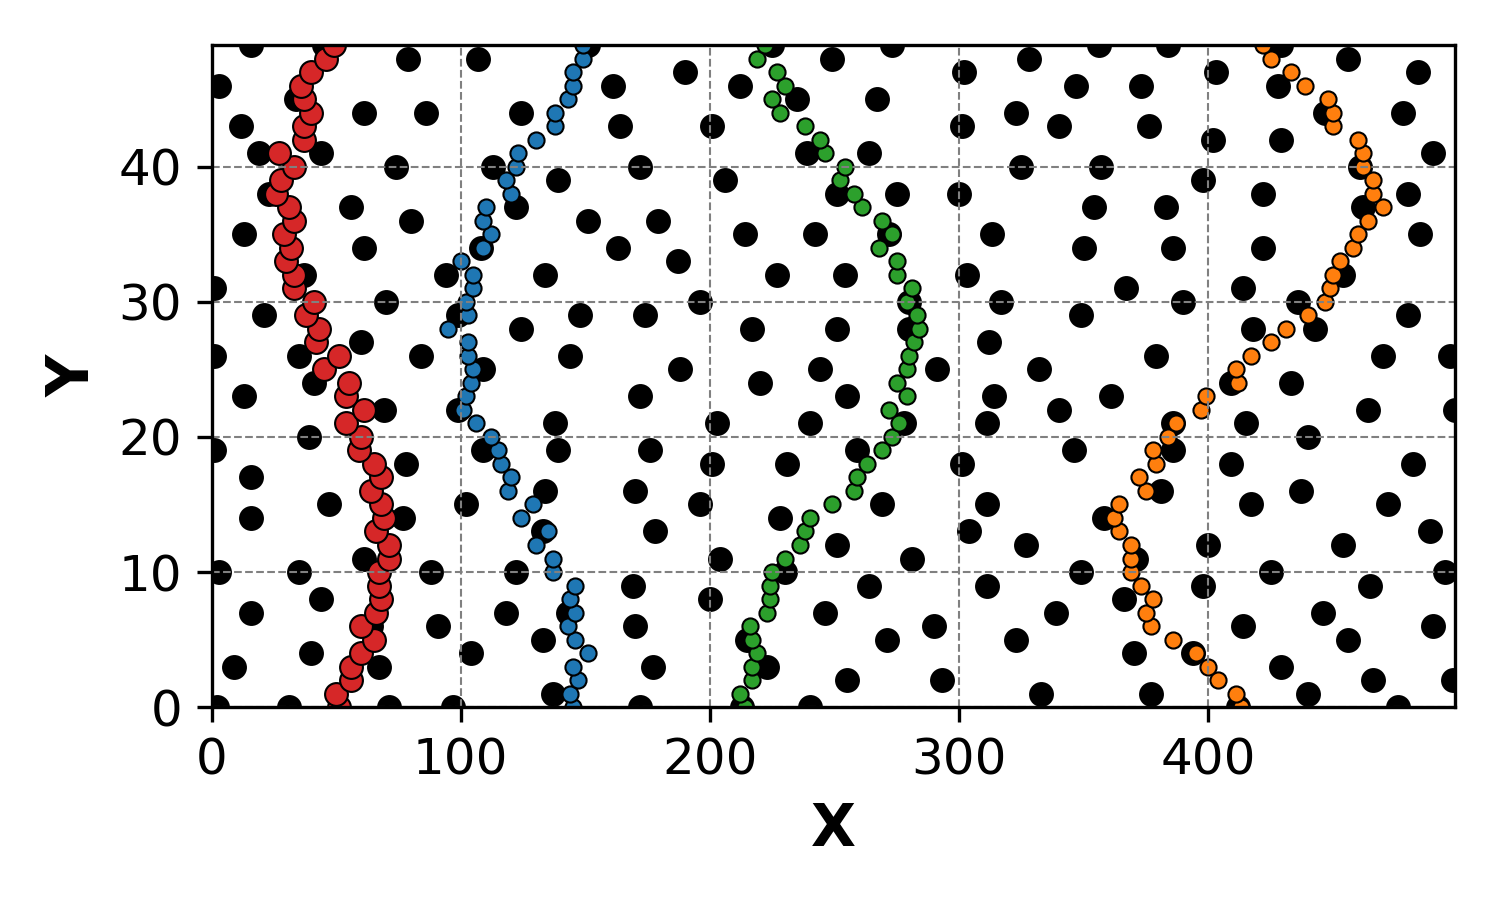
The first piece of code will create, for simplicity, a gridded version of the cloud scatter and the periodic lines:
import numpy as np
import matplotlib.pyplot as plt
from scipy.stats import qmc

# Set the random seed for reproducibility
np.random.seed(42)

# Define the grid size
N, M = 500, 50

# Generate uniformly distributed points using Poisson Disk Sampling
sampler = qmc.PoissonDisk(d=2, radius=0.05, seed=42)
points = sampler.fill_space()
X, Y = points[:, 0], points[:, 1]
X = (X * N).astype(int)
Y = (Y * M).astype(int)

# Define 4 periodic lines
y = np.linspace(0, M-1, M)
disp = np.arange(-N/100, N/100)

def wave(y, A, B, C):
    return np.array(A * np.sin(2*np.pi*(y + B)/M) + C, dtype=int)

line1 = (wave(y, N/25, 0.0, N/10) + np.random.choice(disp, size=M)) % N
line2 = (wave(y, N/20, 0.2*M, N/4) + np.random.choice(disp, size=M)) % N
line3 = (wave(y, N/15, 0.7*M, N/2) + np.random.choice(disp, size=M)) % N
line4 = (wave(y, N/10, 0.5*M, N/1.2) + np.random.choice(disp, size=M)) % N

# check that none of the points overlap with the lines, if a point does overlap, remove it
for i in range(len(X)):
    if X[i] in [line1[Y[i]], line2[Y[i]], line3[Y[i]], line4[Y[i]]]:
        X[i] = -1

# remove the marked points
Y = Y[X != -1]
X = X[X != -1]

# Irrelevant plotting code...
The Mathematical Foundation: Permutations and Parity
To solve this problem, we’ll leverage a mathematical property called permutation parity. Let’s break it down:
What is a Permutation?
A permutation is an ordered arrangement of elements from a set. For example, the set {$1, 2, 3$} has six permutations:
- $(1, 2, 3)$, $(2, 3, 1)$, $(3, 1, 2)$, etc.
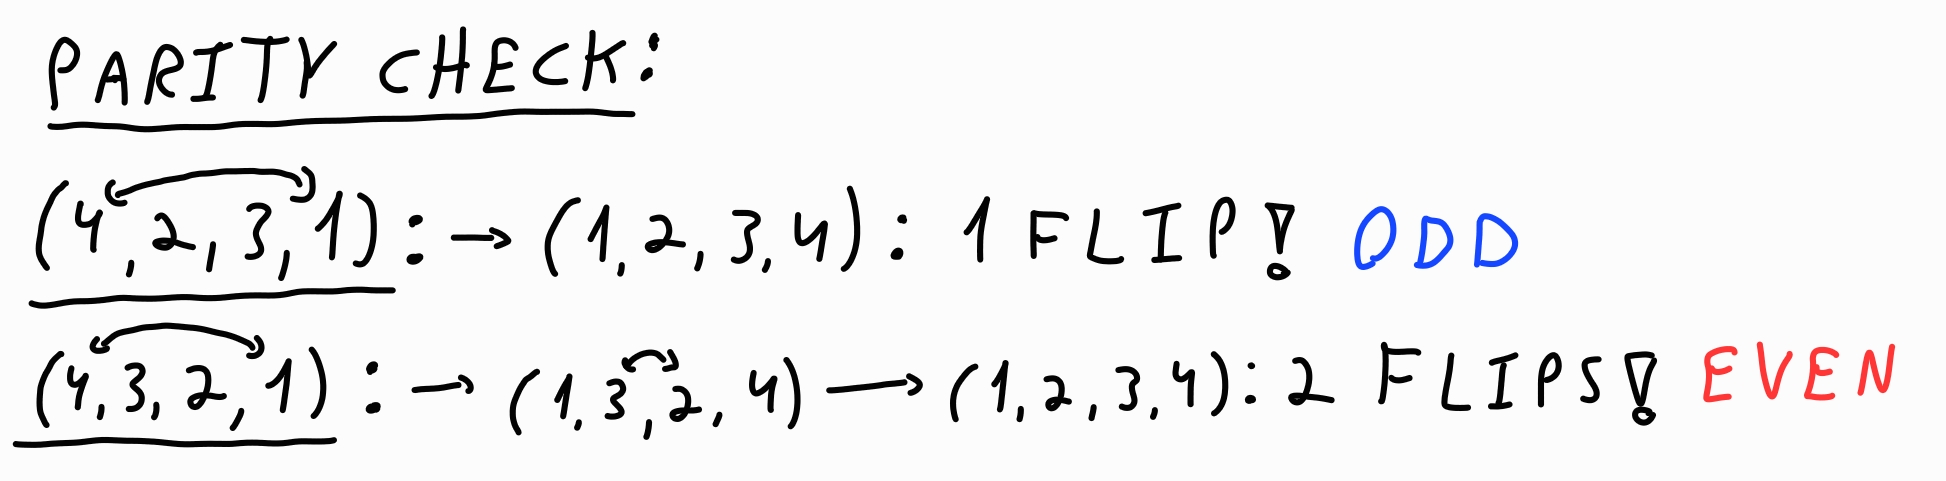
What is Permutation Parity?
The parity of a permutation refers to whether it takes an even or odd number of swaps to return the permutation to its original order. For example:
- $(1, 2, 3)$ (identity permutation) requires 0 swaps → even parity.
- $(2, 1, 3)$ requires 1 swap → odd parity.
This parity property will help us decide the color of each point in the periodic zebra.
Painting the Zebra: The Algorithm
For each point $(x, y)$ in the point cloud, we will follow this procedure (illustrated below):
- Begin by defining the identity permutation $(1, 2, \cdots, 2k, 2k+1)$. Here, the index $i < 2k+1$ corresponds to $l_i$, while the last index corresponds to the point itself.
-
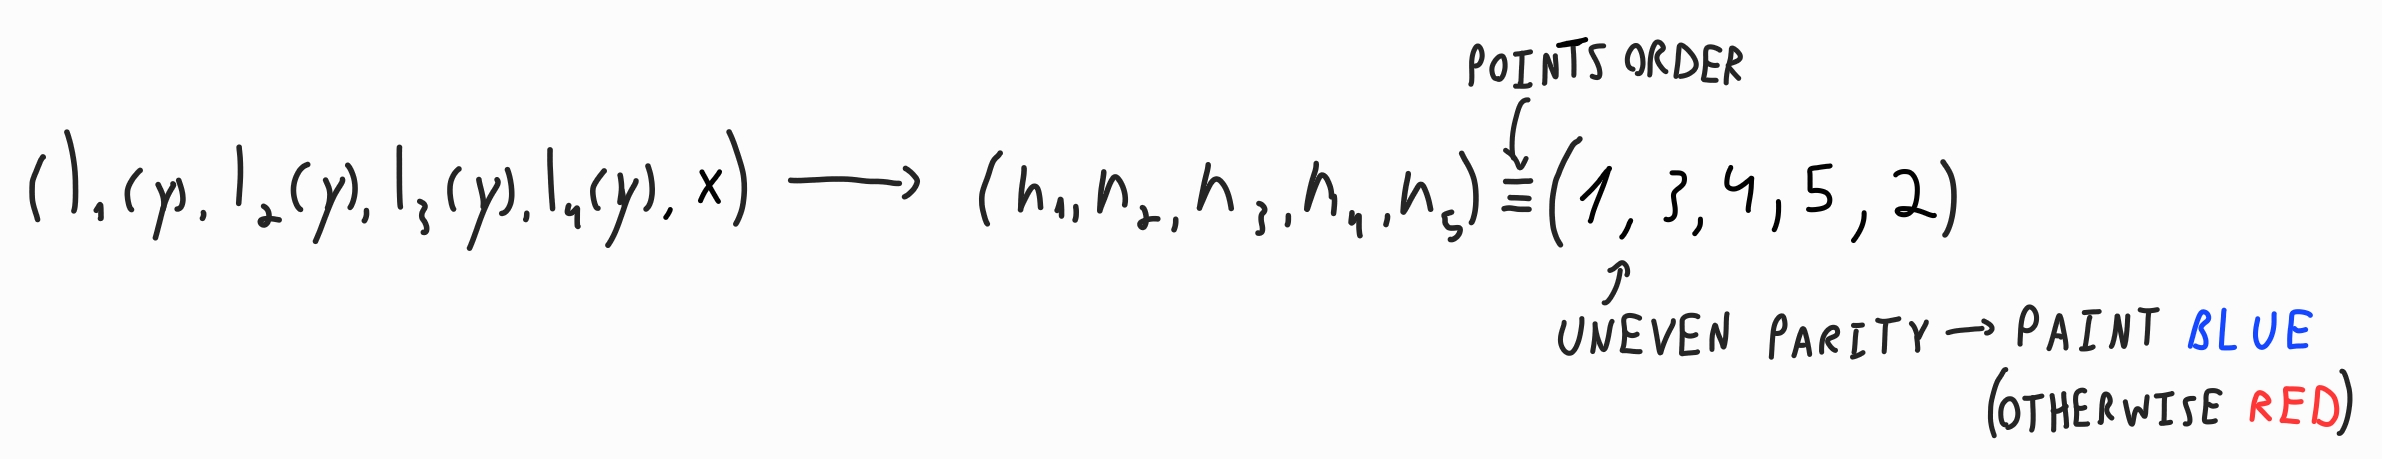
Assign a location to each of the $2k$ interfaces and the point based on their $x$-coordinates ($l_i(y)$ for the interfaces and $x$ for the point), ordered from left to right (or right to left, as long as it is consistent).
This location, denoted by $n_i$, is unique for each index $i$, ensuring it ranges from $1$ to $2k+1$.
- Next, construct a permutation of these locations, referred to as the location permutation, $(n_1, n_2, \cdots, n_{2k}, n_{2k+1})$. Compute the parity of this permutation using SymPy (or similar tools).
- Finally, use the parity to determine the point’s color:
- Even parity → red stripe.
- Odd parity → blue stripe.
The following piece of code does exactly that:
from sympy.combinatorics import Permutation

def find_parity(X,Y,*lines):
    # make the required permutations
    temp = np.vstack([np.vstack([line[Y] for line in lines]), X]).T

    # argsort each row to get the permutation
    permutations = np.argsort(temp, axis=1)

    # find the parity of each permutation
    parities = np.array([Permutation(p).parity() for p in permutations])

    return parities

parities = find_parity(X,Y,line1,line2,line3,line4)

# Irrelevant plotting code...
Why It Works
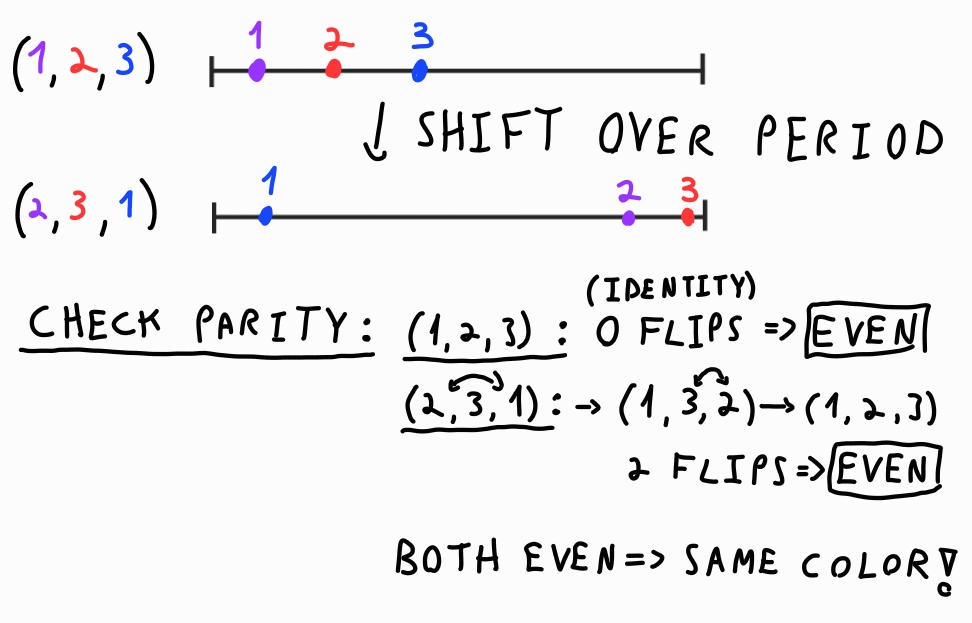
The power of this method lies in the invariance of parity under periodic translations for $(2k+1)$-permutations. As shown below, shifting the entire pattern doesn’t affect the parity of the location permutation:
Also shown for the system constucted by the code:
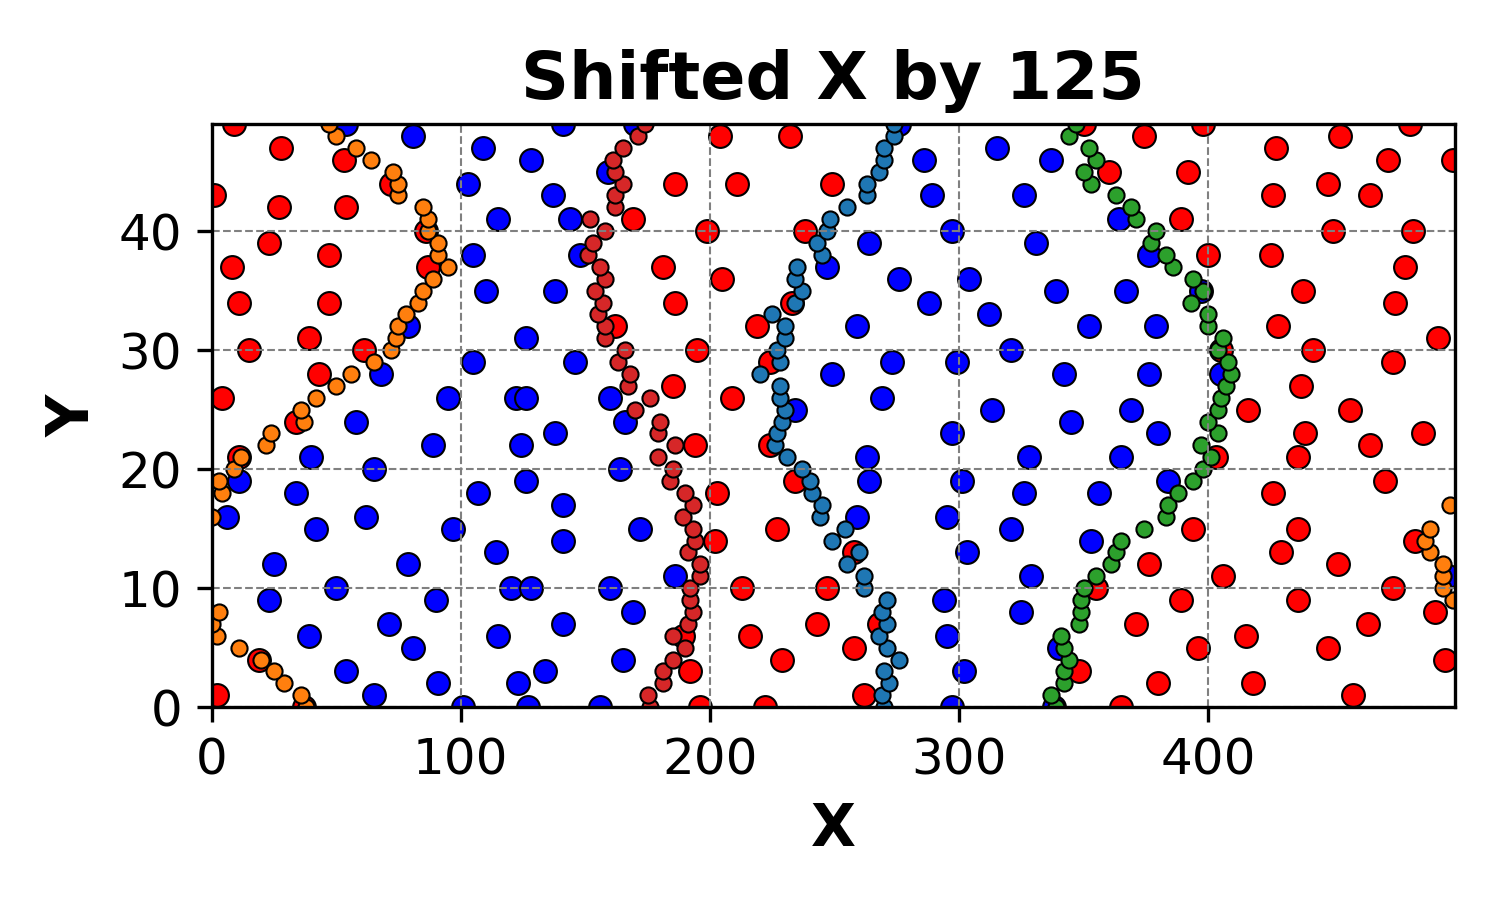
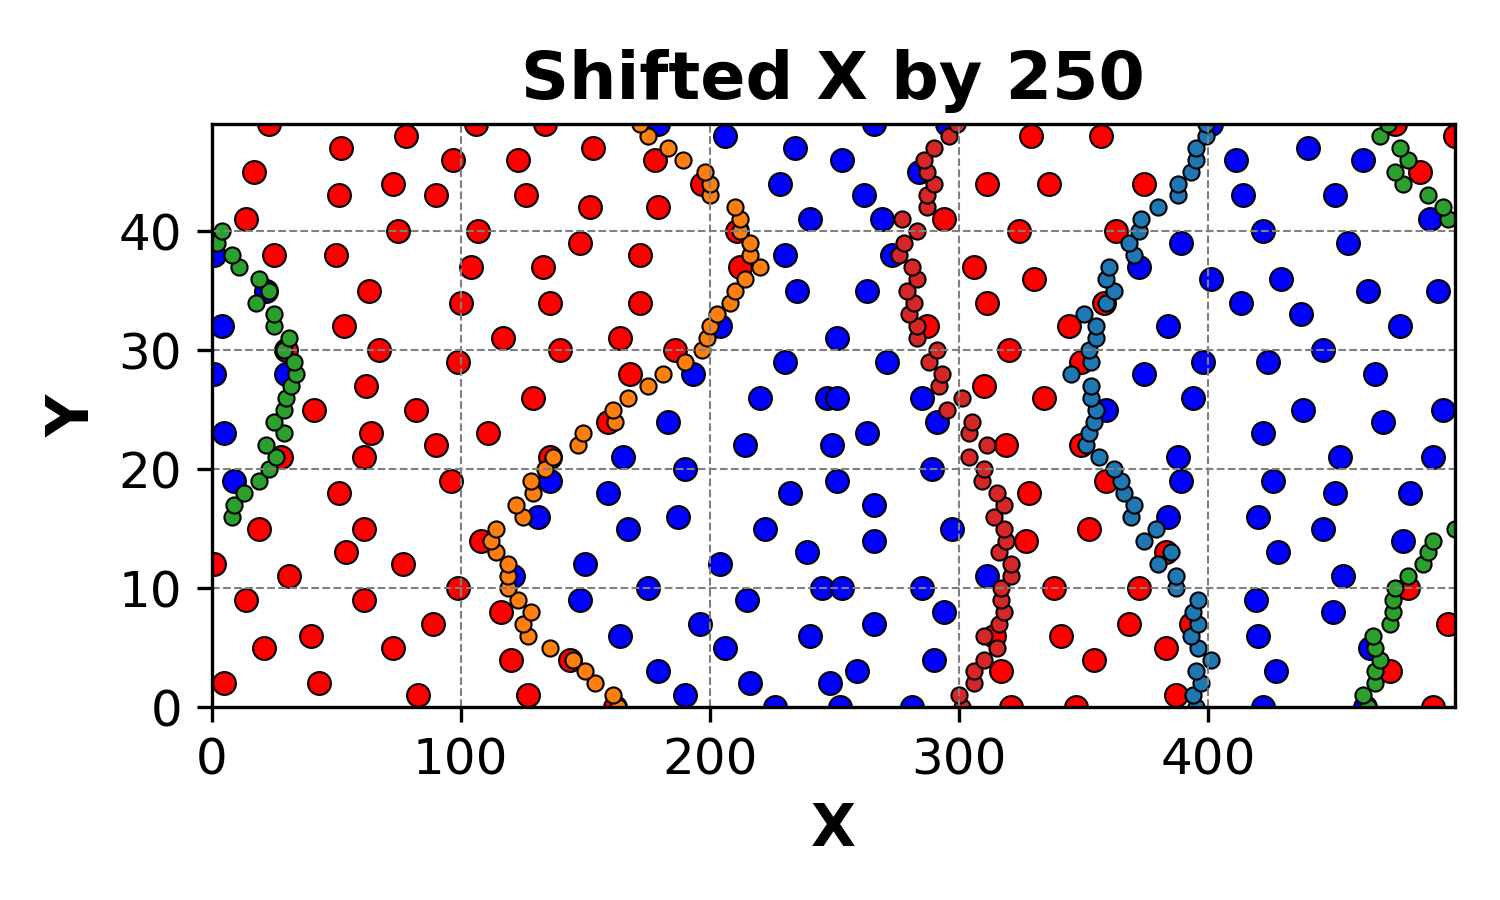
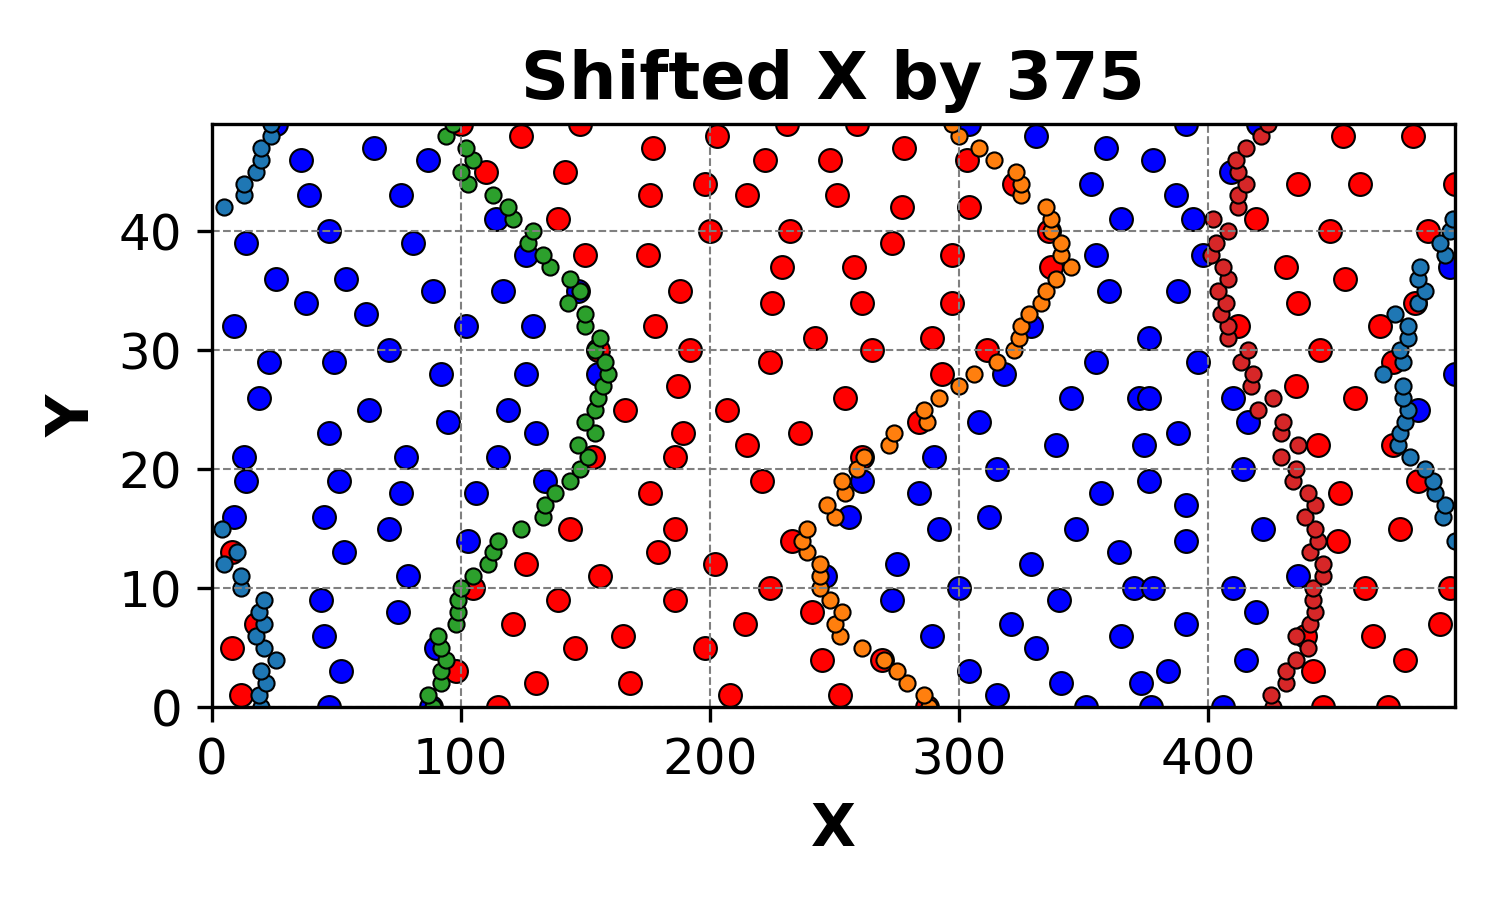
This consistency ensures that our method remains robust, even in the presence of periodic boundaries.
Concluding Thoughts
In this post, we explored a unique way to segment periodic patterns using the mathematical concept of permutation parity. While this method is rooted in abstract mathematics, it offers practical utility for analyzing periodic systems in simulations and beyond.
Why It Matters
This example highlights the broader value of interdisciplinary thinking. Mathematics, physics, and computer science often converge in surprising ways to solve real-world problems. By embracing such connections, we can develop elegant and efficient solutions to complex challenges.
What’s your next step? Experiment with this method in your own simulations or explore other applications where periodicity plays a role. The possibilities are endless!